
- Marketing Analytics
Turn Marketing Data Into Revenue Decisions.
- ANALYTICS SOURCES
Different Data. One Business View
- 01
Web & App Analyticsv
Understand how users arrive, behave, convert, and move through your digital journey
- 02
Paid Media Analytics
- 03
Customer & Revenue Data
Focus: CRM data, lead quality, sales, revenue, AOV, LTV, cohorts, retention, and customer value
- ANALYTICS INFRASTRUCTURE
Good Decisions Start With Reliable Data.
Know whether your data can be trusted.
Build a clean measurement foundation before using data to make investment decisions.
- GA4
- GTM
- Event tracking
- Conversion tracking
- UTMs
- Pixels
- APIs
- Data validation
- Tracking quality
Turn raw data into business metrics.
Connect marketing activity with customer and revenue data using consistent definitions and calculation logic.
- SQL
- BigQuery
- CAC
- ROAS
- CVR
- AOV
- LTV
- Funnel stages
- Cohorts
- KPI definitions
Know what the data is telling you.
Turn connected data into dashboards, analysis, and clear actions for marketing and business teams.
- Power BI
- Looker Studio
- Dashboards
- Attribution
- Funnel analysis
- Revenue contribution
- Trends
- Decision frameworks
From tracking to modeling to revenue, every layer should make the next decision clearer.
From Raw Data to
Better Growth Decisions.
A structured process that connects measurement, analysis, and business economics so marketing decisions are based on evidence, not platform reports.
Audit & Diagnose
Review tracking, data sources, KPI definitions, dashboards, and reporting gaps to find where measurement is incomplete or unreliable.
Connect & Structure
Bring together marketing, website, customer, and revenue data with consistent metrics and business definitions.
Analyze & Visualize
Use SQL, BI, funnel analysis, cohorts, attribution, and performance trends to explain what is driving results.
Decide & Improve
Turn analysis into actions across budget allocation, channels, funnels, offers, and customer acquisition.
Measure. Connect. Analyze. Decide.
No dashboard for the sake of reporting. Every metric should help answer a business question and improve a decision.
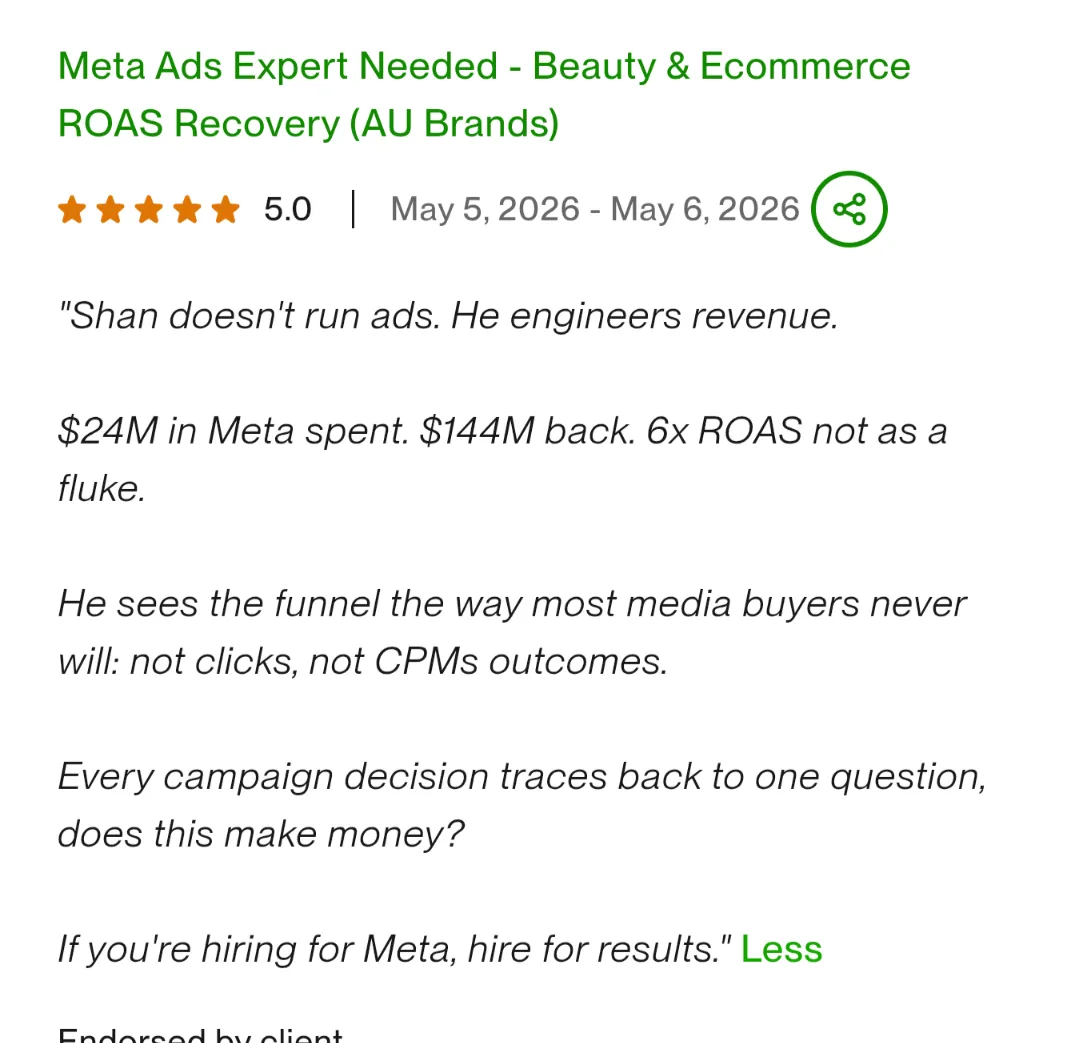
- Client Reviews
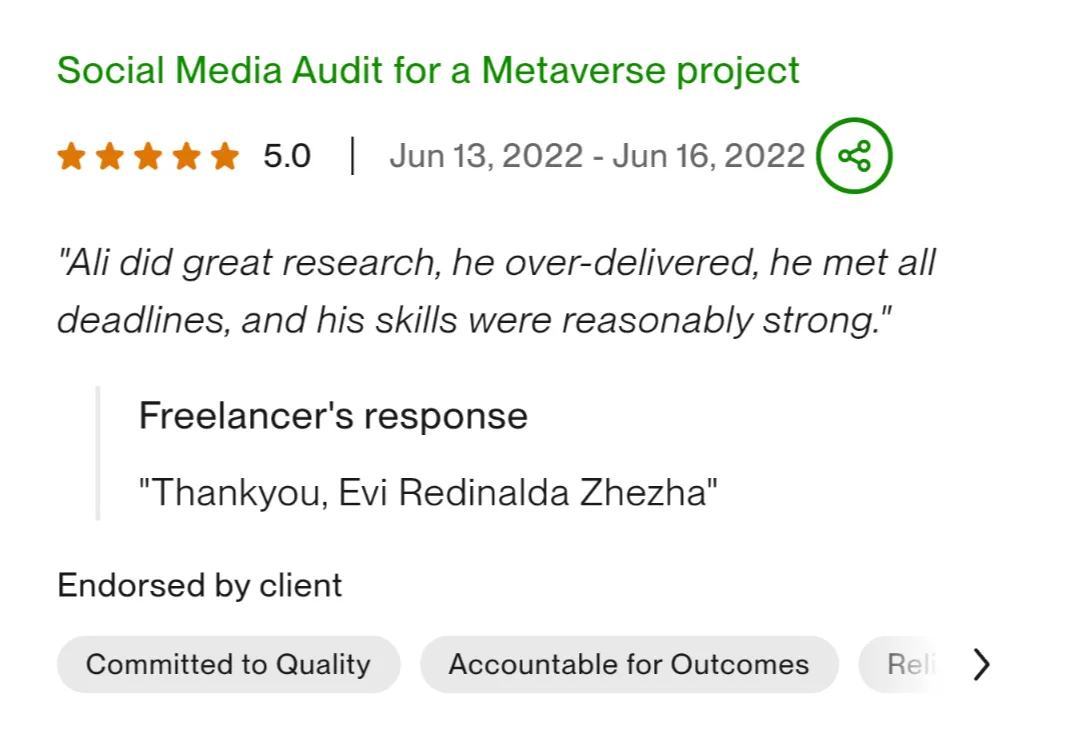
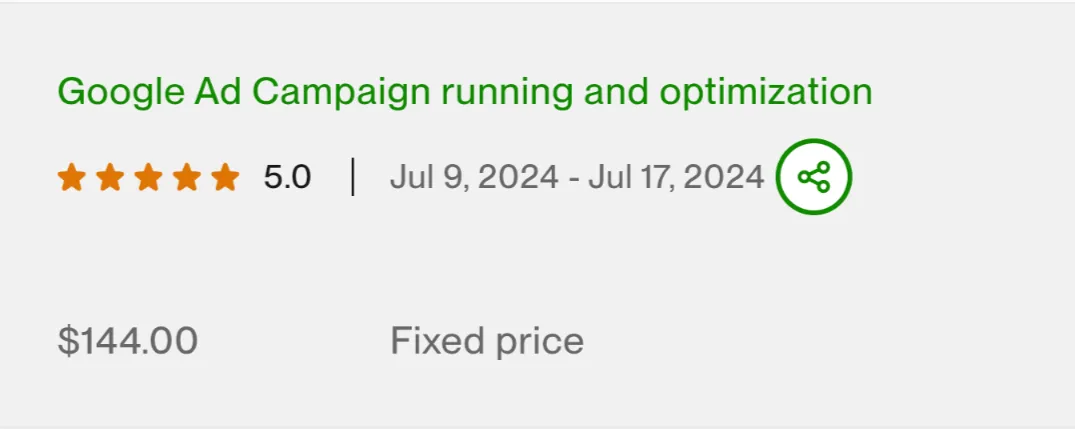
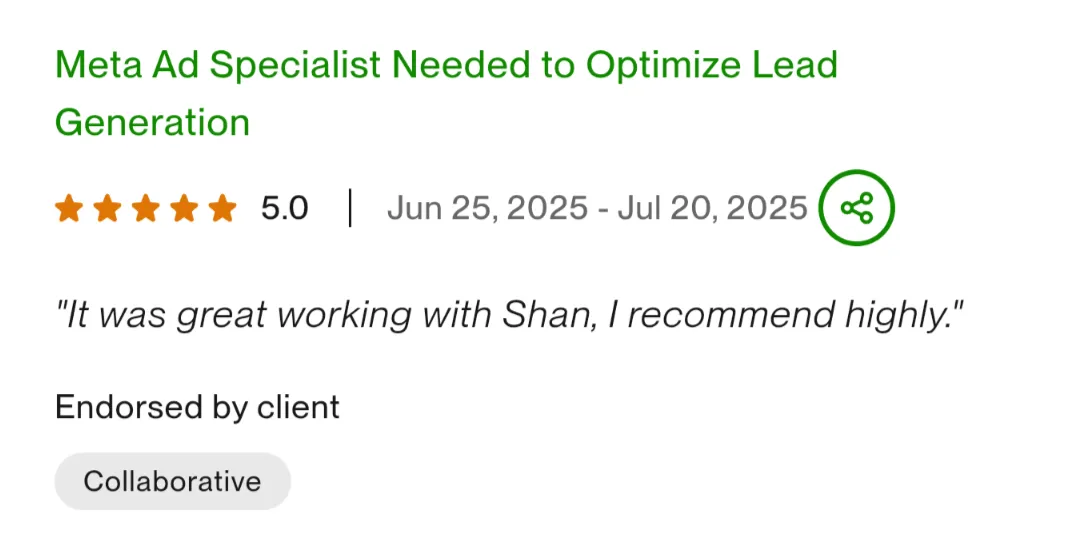
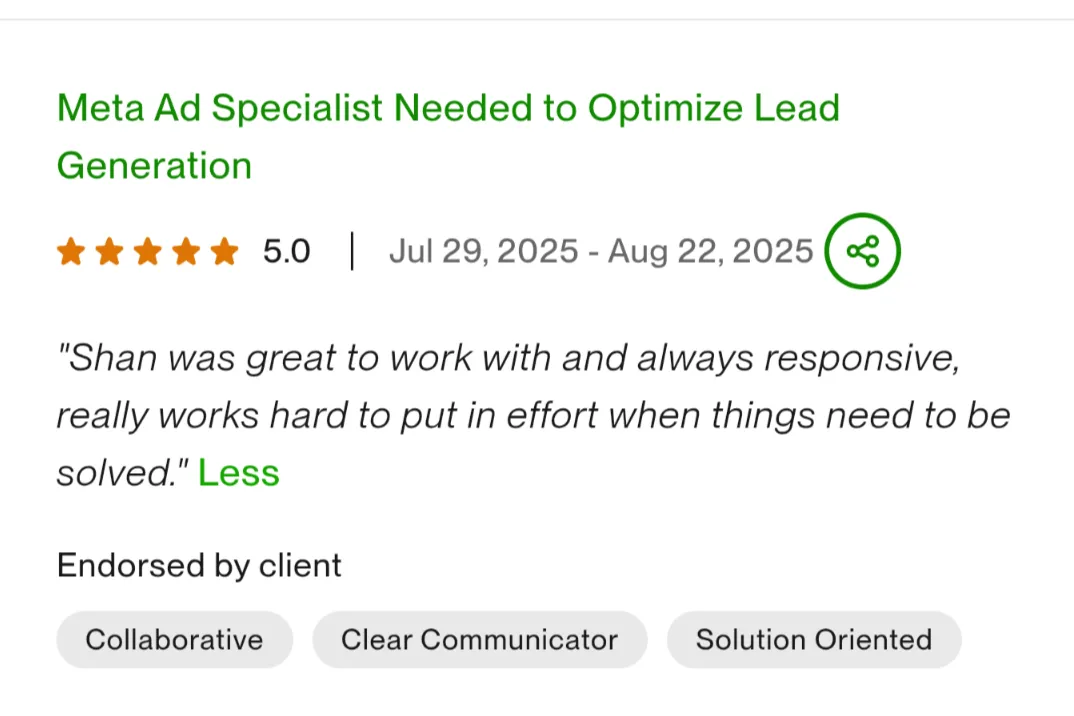
Trusted by founders and marketing teams.
Real 5-star reviews from clients on Upwork.


- MARKETING ANALYTICS AUDIT
You Have the Data. Are You Getting the Right Answers?
- A clear view of your current measurement setup
- Find tracking, data, and KPI gaps
- Better visibility into CAC, ROAS, LTV, and revenue
- We’ll review your needs and get back to you with useful insights.
- MARKETING ANALYTICS FAQ
Questions About Marketing Data, Measurement & Revenue
Marketing analytics is the process of collecting, connecting, analyzing, and interpreting marketing data to improve business decisions.
It helps businesses understand channel performance, customer acquisition, conversion, attribution, and revenue.
A marketing analytics consultant helps businesses improve tracking, connect data sources, define KPIs, analyze performance, build dashboards, and turn marketing data into business decisions.
This can include GA4, GTM, SQL, BigQuery, Power BI, attribution, funnel analysis, and revenue reporting.
Reporting shows what happened. Marketing analytics explains why it happened, what it means, and what should happen next.
A dashboard may show that CAC increased. Analytics investigates where, why, and what action should be taken
The core analytics stack can include the following tools and data sources
• GA4
• Google Tag Manager
• SQL
• BigQuery
• Power BI
• Looker Studio
• Meta Ads data
• Google Ads data
• LinkedIn Ads data
• CRM and revenue data
GA4 helps measure website and app behavior, acquisition sources, events, conversions, and user journeys.
It becomes more useful when its data is connected with paid media, CRM, and revenue data.
Google Tag Manager helps manage and deploy tracking tags and events without changing website code for every measurement update.
A strong GTM setup improves the quality and consistency of analytics data.
SQL allows large marketing and customer datasets to be queried, joined, cleaned, and analyzed.
It is useful when data from advertising platforms, GA4, CRM systems, and revenue sources needs to be combined.
BigQuery is a cloud data warehouse that can store and analyze large datasets. It can be used to connect GA4, advertising, customer, and revenue data for deeper analysis than standard platform
reports allow.
The right metrics depend on the business, but common metrics include the following.
• Revenue
• CAC
• ROAS
• CPA
• Conversion rate
• AOV
• LTV
• LTV:CAC
• Contribution margin
• Lead quality
• Funnel conversion
• Retention
• Revenue contribution
Marketing attribution estimates how different marketing touchpoints contribute to a conversion.
Attribution is useful, but no model gives a perfect view of reality. It should be used alongside customer journeys, funnel analysis, experiments, business economics, and revenue data.
Funnel analysis measures how users move through key stages of the customer journey.
It helps identify where users drop, where conversion slows, and which stages offer the biggest opportunity for improvement.
Cohort analysis groups customers based on a shared characteristic, such as acquisition month or campaign source, and compares their behavior over time.
It can help reveal differences in retention, repeat purchases, LTV, and customer quality.
Yes. Marketing analytics can show which channels, campaigns, audiences, and customer groups create the strongest business outcomes.
This helps improve budget allocation, CAC, ROAS, conversion performance, and revenue efficiency
Not always. A dashboard is useful when teams need recurring access to important metrics.
But the goal is not to build more dashboards. The goal is to make important business questions easier to answer
Marketing analytics is most useful for businesses that meet one or more of these conditions.
• Spend significantly on digital marketing
• Use multiple marketing channels
• Have customer and revenue data
• Struggle with attribution
• Rely heavily on manual reporting
• Cannot clearly connect marketing to revenue
• Need better visibility into CAC, LTV, or funnel performance